Introduction to Dask-image#
Dask-image is a Dask sub-package specialized for handling images. It supports many of the functions from scipy.ndimage for Dask.arrays
dask_image.imread
dask_image.ndfilters
dask_image.ndfourier
dask_image.ndinterp
dask_image.ndmeasure
dask_image.ndmorph
In this notebook, we will use Dask-image for lazy loading a large image and filtering it.
Acknowledgements
This notebook was part of the 2023 workshop on Accelerated large-scale image procesing in Python. We kindly acknowledge them for sharing their training material with us!
Lazy loading with Dask_image.imread#
import os
import dask.array as da
import dask_image.imread
import urllib.request
import numpy as np
import skimage.io
import itertools
from pathlib import Path
import matplotlib.pyplot as plt
def show_images(images, zoom=False, titles=None, cmap="gray", figsize=(20,10)):
    zoom_mask = (slice(200, 800), slice(2320, 2750))
    if cmap is None or isinstance(cmap, str):
        cmap = [cmap, ] * len(images)
    if titles is None or isinstance(titles, str):
        titles = [titles, ] * len(images)
    if zoom is None or isinstance(zoom, bool):
        zoom = [zoom, ] * len(images)
    fig, axs = plt.subplots(1, len(images), figsize=figsize)
    for ax, image in enumerate(images):
        if zoom[ax]:
            axs[ax].imshow(image[zoom_mask], cmap=cmap[ax])
            axs[ax].set_title(titles[ax] + "(zoom)")
        else:
            axs[ax].imshow(image, cmap=cmap[ax])
            axs[ax].set_title(titles[ax])
        axs[ax].axis("off")
    fig.tight_layout()
# Download image -- this can take a bit (approx. 100Mb)
url = "https://stsci-opo.org/STScI-01EVSZWCFZVP2R5ZRV7HEZAGP6.tif"

data_path = Path(os.path.expanduser(
    os.path.join(os.getenv("XDG_DATA_HOME", "~"), ".field-guide")
))

fname = 'hubble.tif'

hubble_image = os.path.join(data_path, fname)
urllib.request.urlretrieve(url, hubble_image)

def chunk_image(image, chunk_size, output_dir):
    shape = np.array(image.shape)
    chunk = np.array(chunk_size)
    chunk_counts = shape // chunk
    for ids in itertools.product(*[np.arange(0, count) for count in chunk_counts]):
        slices = tuple([slice(i * ch, (i + 1) * ch) for i, ch in zip(ids, chunk)])
        string = "-".join([str(i).zfill(2) for i in ids])
        skimage.io.imsave(
            os.path.join(output_dir, f"image-{string}.png"), (image[slices] * 255).astype(np.uint8),
            check_contrast=False
        )

# Crop/chunk size
chunk_size = (256, 256, 3)

# Save directory
output_dir = os.path.join(data_path, "hubble")
Path(os.path.join(data_path, "hubble")).mkdir(exist_ok=True)

from skimage.io import imread
from skimage.util import img_as_float

img = img_as_float(imread(hubble_image))

# Run cropping function
chunk_image(img, chunk_size, output_dir)
filename_pattern = os.path.join(data_path, "hubble", "image-*.png")
tiled_hubble_images = dask_image.imread.imread(filename_pattern)

# Convert image to float
tiled_hubble_images = tiled_hubble_images.astype(float) / 255.0
tiled_hubble_images
|
||||||||||||||||
# REMINDER: Dask is lazy by default
from sys import getsizeof
print(f"Size of `dask-image`: {getsizeof(tiled_hubble_images)} bytes")
Size of `dask-image`: 80 bytes
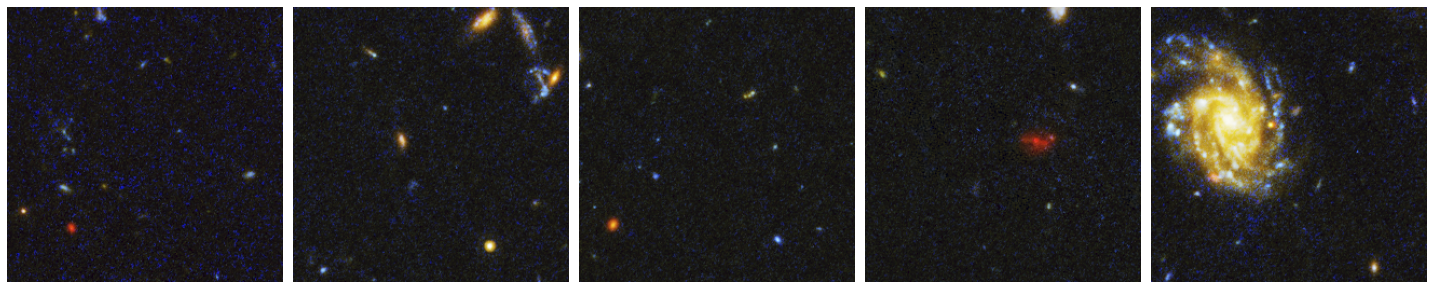
show_images(
    [
        tiled_hubble_images[0],
        tiled_hubble_images[5],
        tiled_hubble_images[10],
        tiled_hubble_images[15],
        tiled_hubble_images[20],
    ]
)
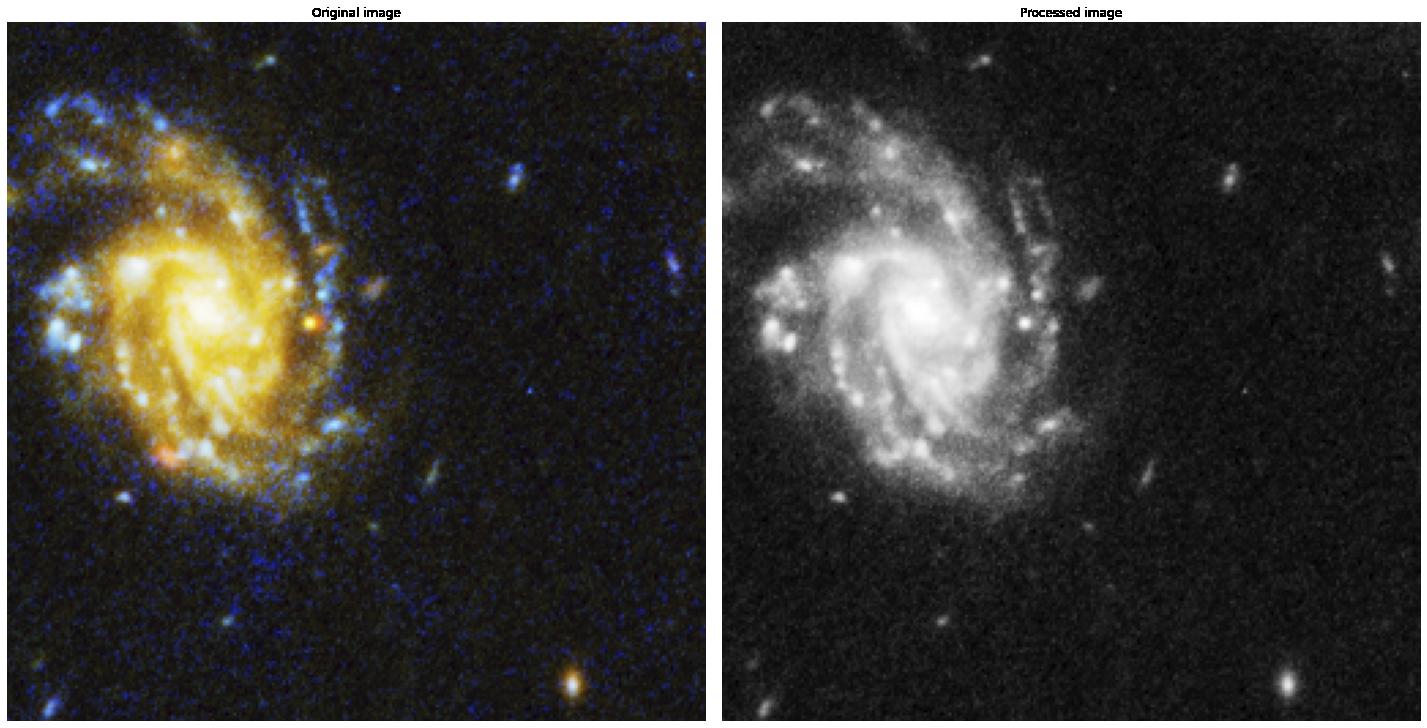
2) Applying your own custom function to images#
Next you’ll want to do some image processing, and apply a function to your images.
We’ll use a very simple example: converting an RGB image to grayscale.
To convert our image to grayscale, we’ll use the equation to calculate luminance:
Y = 0.2125 R + 0.7154 G + 0.0721 B
We’ll write the function for this equation as follows:
def grayscale(rgb):
    result = (rgb[..., 0] * 0.2125) + (rgb[..., 1] * 0.7154) + (rgb[..., 2] * 0.0721)
    return result
While NumPy attempts to optimize memory usage, in-place operations (where memory is reused) aren’t always possible, especially when dealing with complex arithmetic operations. During the computation within the grayscale function, NumPy creates temporary arrays. When you perform operations like rgb[..., 0] * 0.2125, it results in intermediate arrays being created in memory.
# Demo: Temporary Arrays and In-Place Operations
As you can see, this operation requires to have an extra copy of (one channel of) the input image in memory. Many operations require the creation, even temporarily, of array of the same size as the image. This can easily pose a bottleneck in our pipeline!
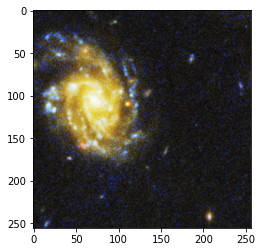
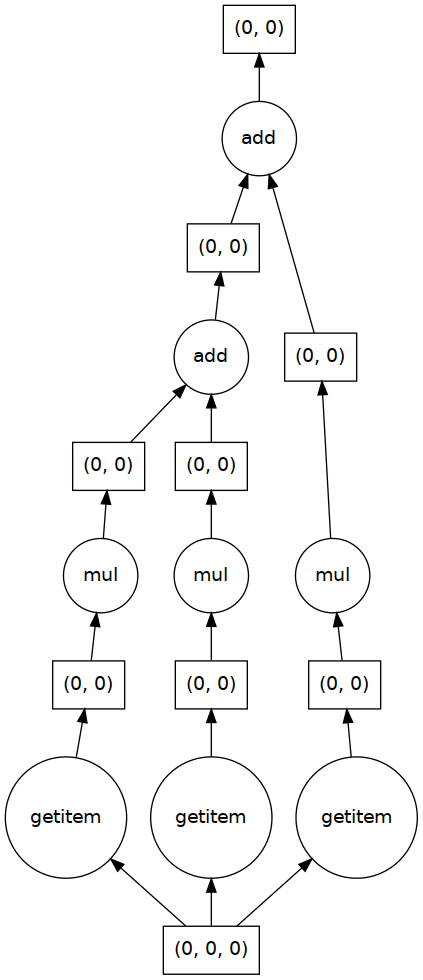
Let’s apply our custom function to the a single chunk of our image and visualize the computation graph.
TIP: Visualizing the computation graph isn’t necessary but most of the time it’s helpful to know what dask is doing under the hood, and it can also be very useful for debugging problems.
hubble_image = tiled_hubble_images[20].persist()

plt.imshow(hubble_image)
<matplotlib.image.AxesImage at 0x77e7103bef40>
result_single_image = grayscale(hubble_image)
print(result_single_image)
result_single_image.visualize()
dask.array<add, shape=(256, 256), dtype=float64, chunksize=(256, 256), chunktype=numpy.ndarray>
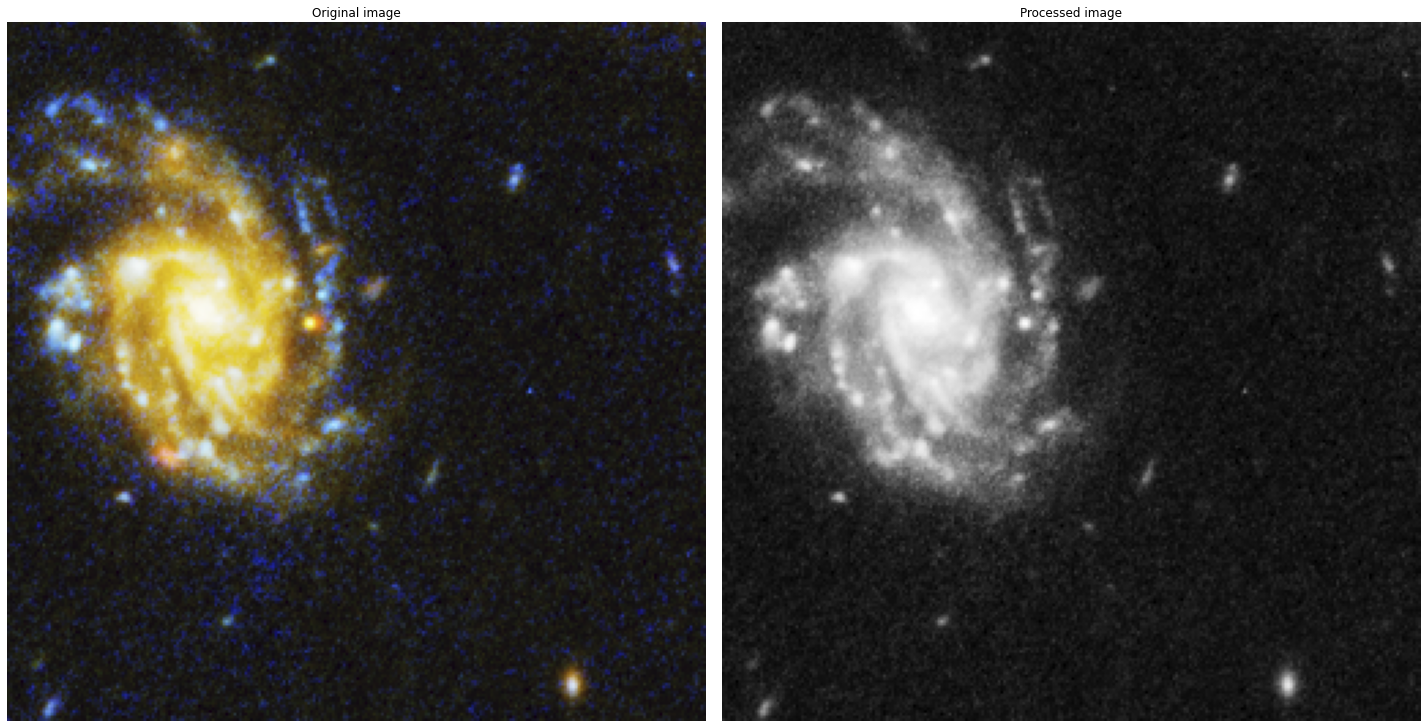
print("Original image dimensions: ", hubble_image.shape)
print("Processed image dimensions:", result_single_image.shape)

show_images(
    [hubble_image, result_single_image],
    titles=["Original image", "Processed image"],
    cmap=[None, "gray"],
)
Original image dimensions:  (256, 256, 3)
Processed image dimensions: (256, 256)
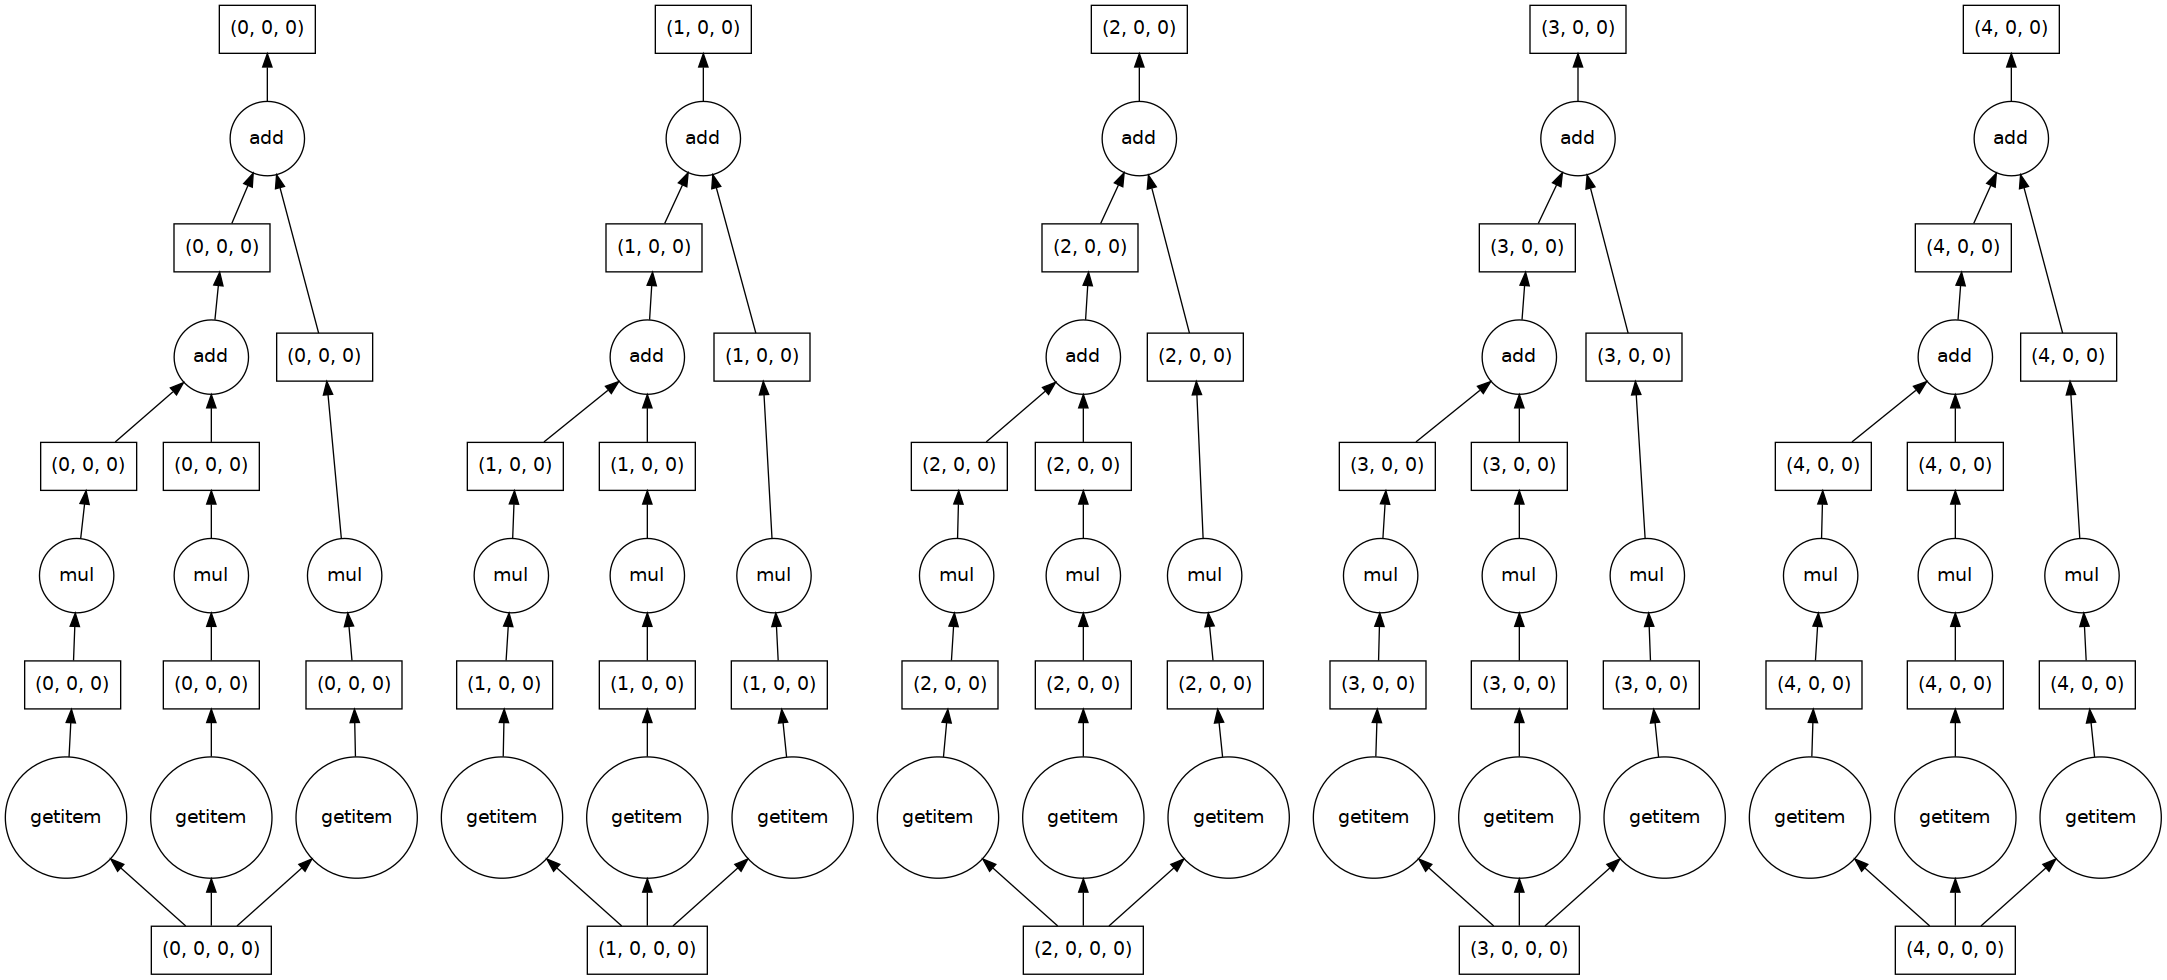
Embarrassingly parallel problems#
The syntax is identical to apply a function to multiple images or Dask chunks. This is an example of an embarrassingly parallel problem, and we see that Dask automatically creates a computation graph for each image chunk.
result = grayscale(tiled_hubble_images[:5].persist())
print(result)
result.visualize()
dask.array<add, shape=(5, 256, 256), dtype=float64, chunksize=(1, 256, 256), chunktype=numpy.ndarray>
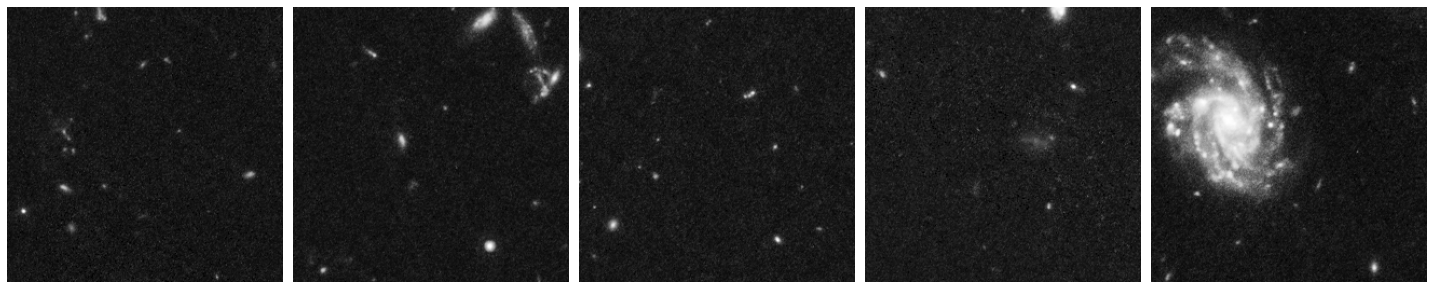
result = grayscale(tiled_hubble_images)
show_images(
    [
        result[0],
        result[5],
        result[10],
        result[15],
        result[20],
    ]
)
Let’s do some Dask-image processing#
For illustration purposes, let’s perform some edge enhancement of our sky image.
A very simple approach for edge enhancement is the following:
Where:
\(\hat{\mathbf{I}}\) is the enhenced image,
\(\mathbf{I}\) is the original image,
\(\bar{\mathbf{I}}_{\sigma} \) is a smoothed version of \(\mathbf{I}\), with smoothing parameter \(\sigma\), and
\(\alpha \in [0, 1]\) controls the level of enhancement.
Let’s complete the following function edge_enhancement(image, sigma) that uses dask_image.ndfilters.gaussian_filter:
def edge_enhancement(image, sigma, alpha):
    """
    Parameters
    ----------
    image: Dask.array (2d)
        Input image to enhance.
    sigma: float
        Smoothing parameter.
    alpha: float [0, 1]


    Returns
    -------
    out_image: Dask.array (2d)
        Edge enhanced image.
    """

    return NotImplementedError
import dask_image.ndfilters

def edge_enhancement(image, sigma, alpha):
    """
    Parameters
    ----------
    image: Dask.array (2d)
        Input image to enhance.
    sigma: float
        Smoothing parameter.
    alpha: float [0, 1]


    Returns
    -------
    out_image: Dask.array (2d)
        Edge enhanced image.
    """
    assert sigma > 0
    assert  0 <= alpha <= 1
    smoothed_image = dask_image.ndfilters.gaussian_filter(image, sigma=sigma)
    edge_enhanced_image = abs(image - smoothed_image)
    edge_enhanced_image += alpha * image
    return edge_enhanced_image
Join processed chunks#
Because our edge_enhancement function relies on a convolution (with a smoothing kernel), we need to concatenate the small image chunks together into the shape of the image.
This is important when doing convolutions or other analysis that process the neighborhood of each pixel.
This joined image will still be a lazy array, but each chunk will access the edge values of the neighboring chunks.
Note: We could have done this in the beginning too.
# Toy Dataset for visualisation
data = [result[20], result[21]]
toy_combined_image = da.block(data).persist()
toy_combined_image
|
||||||||||||||||
edge_enhanced_toy = edge_enhancement(toy_combined_image.persist(),
                                     sigma=20,
                                     alpha=0.5)
Now try to match the different parts of the task graph with the edge enhancement equation:
edge_enhanced_toy
|
||||||||||||||||
edge_enhanced_toy.visualize(rankdir="LR")
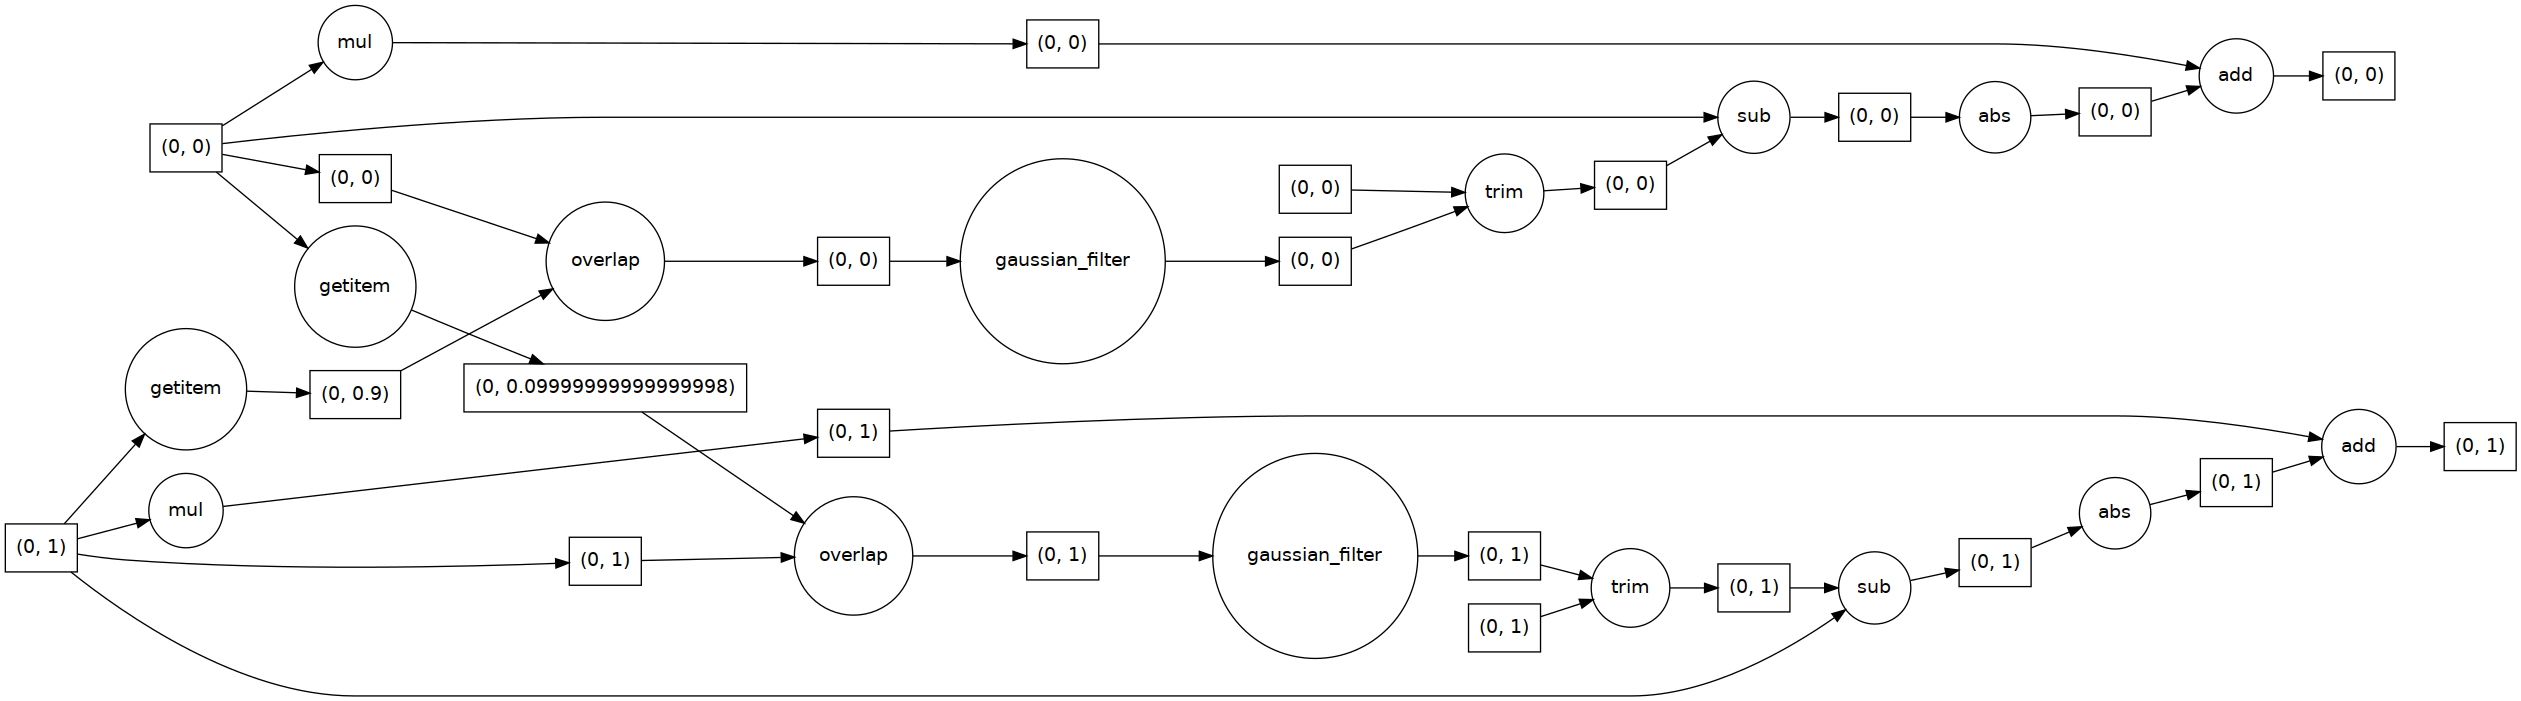
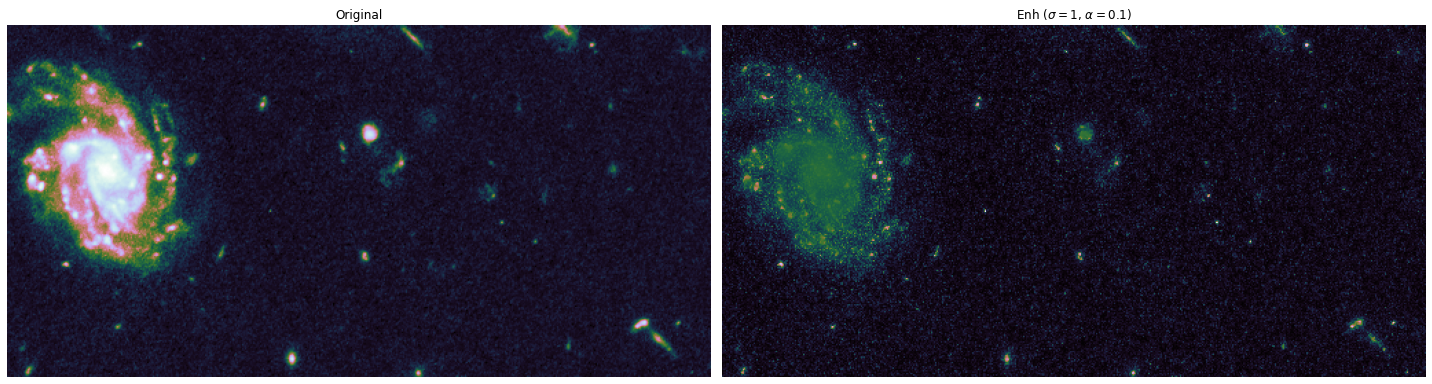
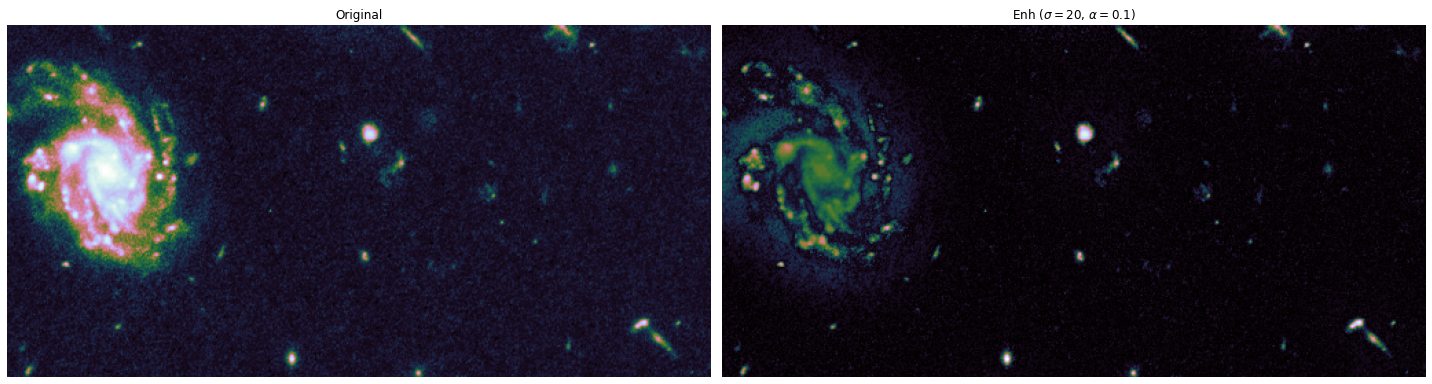
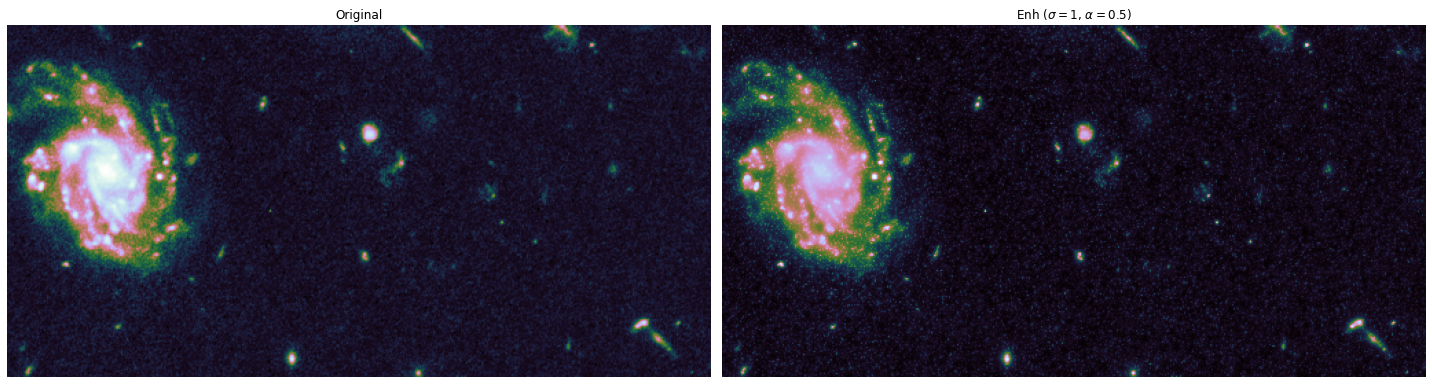
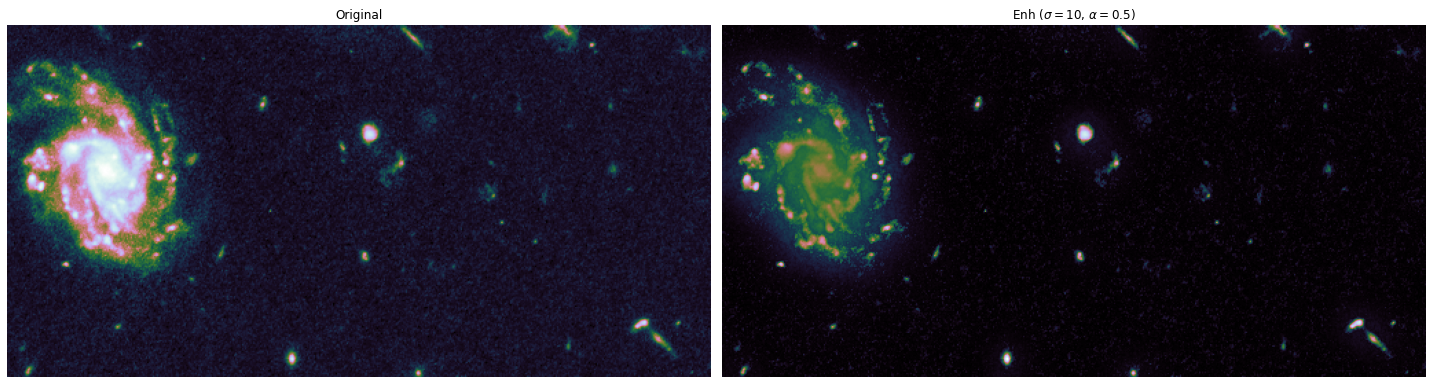
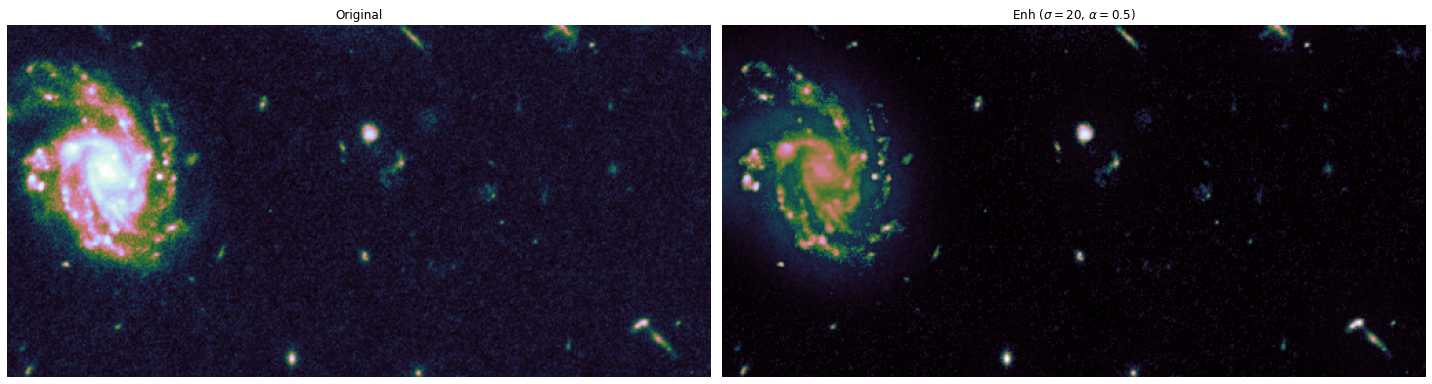
The toy dataset is useful to understand the task graph, and it can also be used to select good values for \(\sigma\) and \(\alpha\):
alphas = [0.1, 0.5]
sigmas = [1, 10, 20]

for alpha, sigma in itertools.product(alphas, sigmas):
    edge_enhanced_toy = edge_enhancement(toy_combined_image,
                                     sigma=sigma,
                                     alpha=alpha)
    # Normalize between 0 and 1
    edge_enhanced_toy -= edge_enhanced_toy.min()
    edge_enhanced_toy /= edge_enhanced_toy.max()

    show_images(
        [toy_combined_image, edge_enhanced_toy],
        titles=["Original", fr"Enh ($\sigma={sigma}$, $\alpha={alpha}$)"],
        cmap="cubehelix"
    )

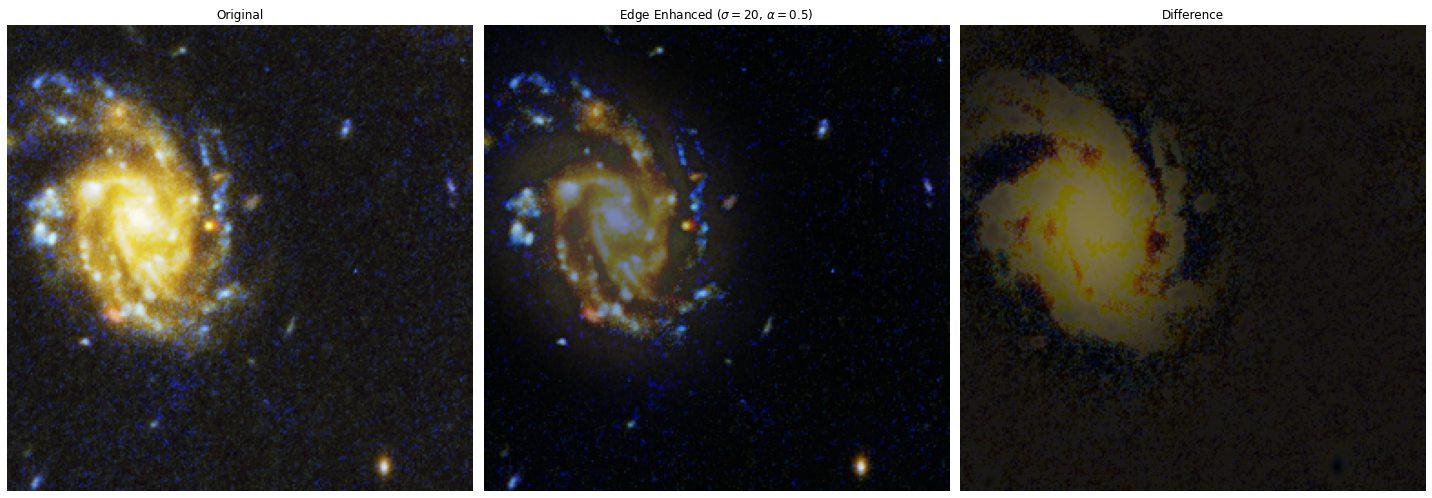
Final step: run full pipeline on RGB dataset, and save for later.#
# Enhancing parameters
sigma = 20
alpha = 0.5

# Full Dataset
edge_enhanced_image = []
combined_image = []
# For each RGB
for j in range(3):
    # Join chunks to have access to neighborhoods
    data = [
        [img[..., j] for img in tiled_hubble_images[i * 28 : (i + 1) * 28]]
        for i in range(24)
    ]
    combined_image.append(da.block(data))

    # Join chunks to have access to neighborhoods
    edge_enh = edge_enhancement(combined_image[j], sigma=sigma, alpha=alpha)
     # Normalize between 0 and 1
    edge_enh -= edge_enh.min()
    edge_enh /= edge_enh.max()
    edge_enhanced_image.append(edge_enh)

# Convert list to dask array
edge_enhanced_image = da.dstack(edge_enhanced_image)
combined_image = da.dstack(combined_image)
edge_enhanced_image
|
||||||||||||||||
show_images(
    [
        combined_image.blocks[0, 20],
        edge_enhanced_image.blocks[0, 20],
        abs((combined_image-edge_enhanced_image).blocks[0, 20]).clip(0,1),
    ],
    titles=["Original", fr"Edge Enhanced ($\sigma={sigma}$, $\alpha={alpha}$)", "Difference"],
)