🚩 Image data handling using Python, Numpy, and Scikit-image#
In this tutorial, we will introduce the basics of image data manipulation in Python using Numpy and Scikit-image. We will cover how to load images, display them, and manipulate their contents using these libraries.
Loading and displaying and image#
First, we load an example image from the skimage.data module, which provides a variety of example images to play with.
import skimage.data

image = skimage.data.coins()

image
array([[ 47, 123, 133, ...,  14,   3,  12],
       [ 93, 144, 145, ...,  12,   7,   7],
       [126, 147, 143, ...,   2,  13,   3],
       ...,
       [ 81,  79,  74, ...,   6,   4,   7],
       [ 88,  82,  74, ...,   5,   7,   8],
       [ 91,  79,  68, ...,   4,  10,   7]], dtype=uint8)
We can see that images are just matrices of intensities. However, showing them as such is not convenient. For visualizing images in notebooks, we can use the imshow function.
from skimage.io import imshow

imshow(image)
<matplotlib.image.AxesImage at 0x7c9eb226e820>
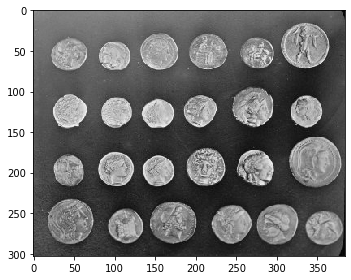
Image properties#
We can check that the image is represented as a Numpy array. We can explore several attributes of this image array:
print(f'Type of the image: {type(image)}')  # Should be a numpy array
print(f'Shape of the image: {image.shape}')  # Dimensions of the image
print(f'Minimum pixel value: {image.min()}')  # Min pixel value
print(f'Maximum pixel value: {image.max()}')  # Max pixel value
print(f'Mean pixel value: {image.mean():.2f}')  # Average pixel value
Type of the image: <class 'numpy.ndarray'>
Shape of the image: (303, 384)
Minimum pixel value: 1
Maximum pixel value: 252
Mean pixel value: 96.86
Accessing and Modifying Pixel Values#
We can access specific pixels or modify parts of the image array using two powerful Numpy features: indexing and masking.
Indexing can be used to access and modify subregions of the image.
# Pixel value at coordinate (10, 20)
image[10, 20]
125
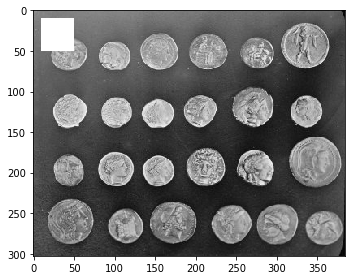
image[10:50, 10:50] = 255  # Set a 40x40 square to white

imshow(image)
<matplotlib.image.AxesImage at 0x7c9eb09ba3d0>
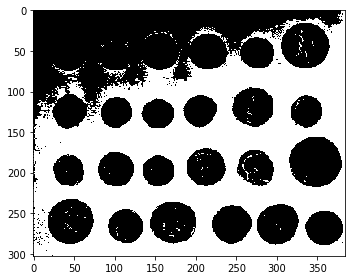
Masking is used to create masks to isolate parts of an image based on pixel values.
mask = image < 87

imshow(mask)
<matplotlib.image.AxesImage at 0x7c9eb096d5b0>
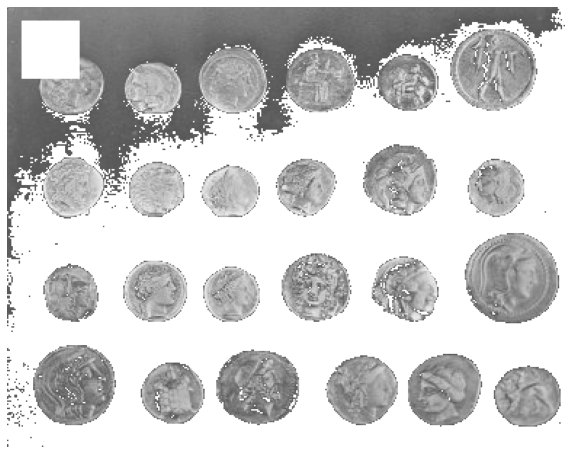
image[mask] = 255

import matplotlib.pyplot as plt

def display_image(image, title=''):
    fig, ax = plt.subplots(figsize=(10, 10))
    ax.imshow(image, vmin=0, vmax=255, cmap=plt.cm.gray)
    ax.set_title(title)
    ax.axis('off')
    return fig

fig = display_image(image)
plt.show()
Conclusion#
This tutorial introduced basic operations for image analysis using Numpy and Scikit-image. By manipulating image data, we can prepare images for more complex image analysis applications.
Going further